AI ICP TIERING

Let AI Define Your ICP — Based on What Actually Wins

Stop guessing who your ideal customer is. Warmly's AI analyzes your closed-won deals, finds the patterns that matter, and scores every account in your TAM. It gets smarter with every deal you close.
AI ICP Tiering is an intelligent account scoring system that analyzes your closed-won deals to discover patterns, automatically scores every account in your TAM based on fit, and continuously improves accuracy as you close more deals.
4.8/5 based on G2 reviews for AI-powered ICP scoring
Crush your quota

What is AI ICP Tiering?

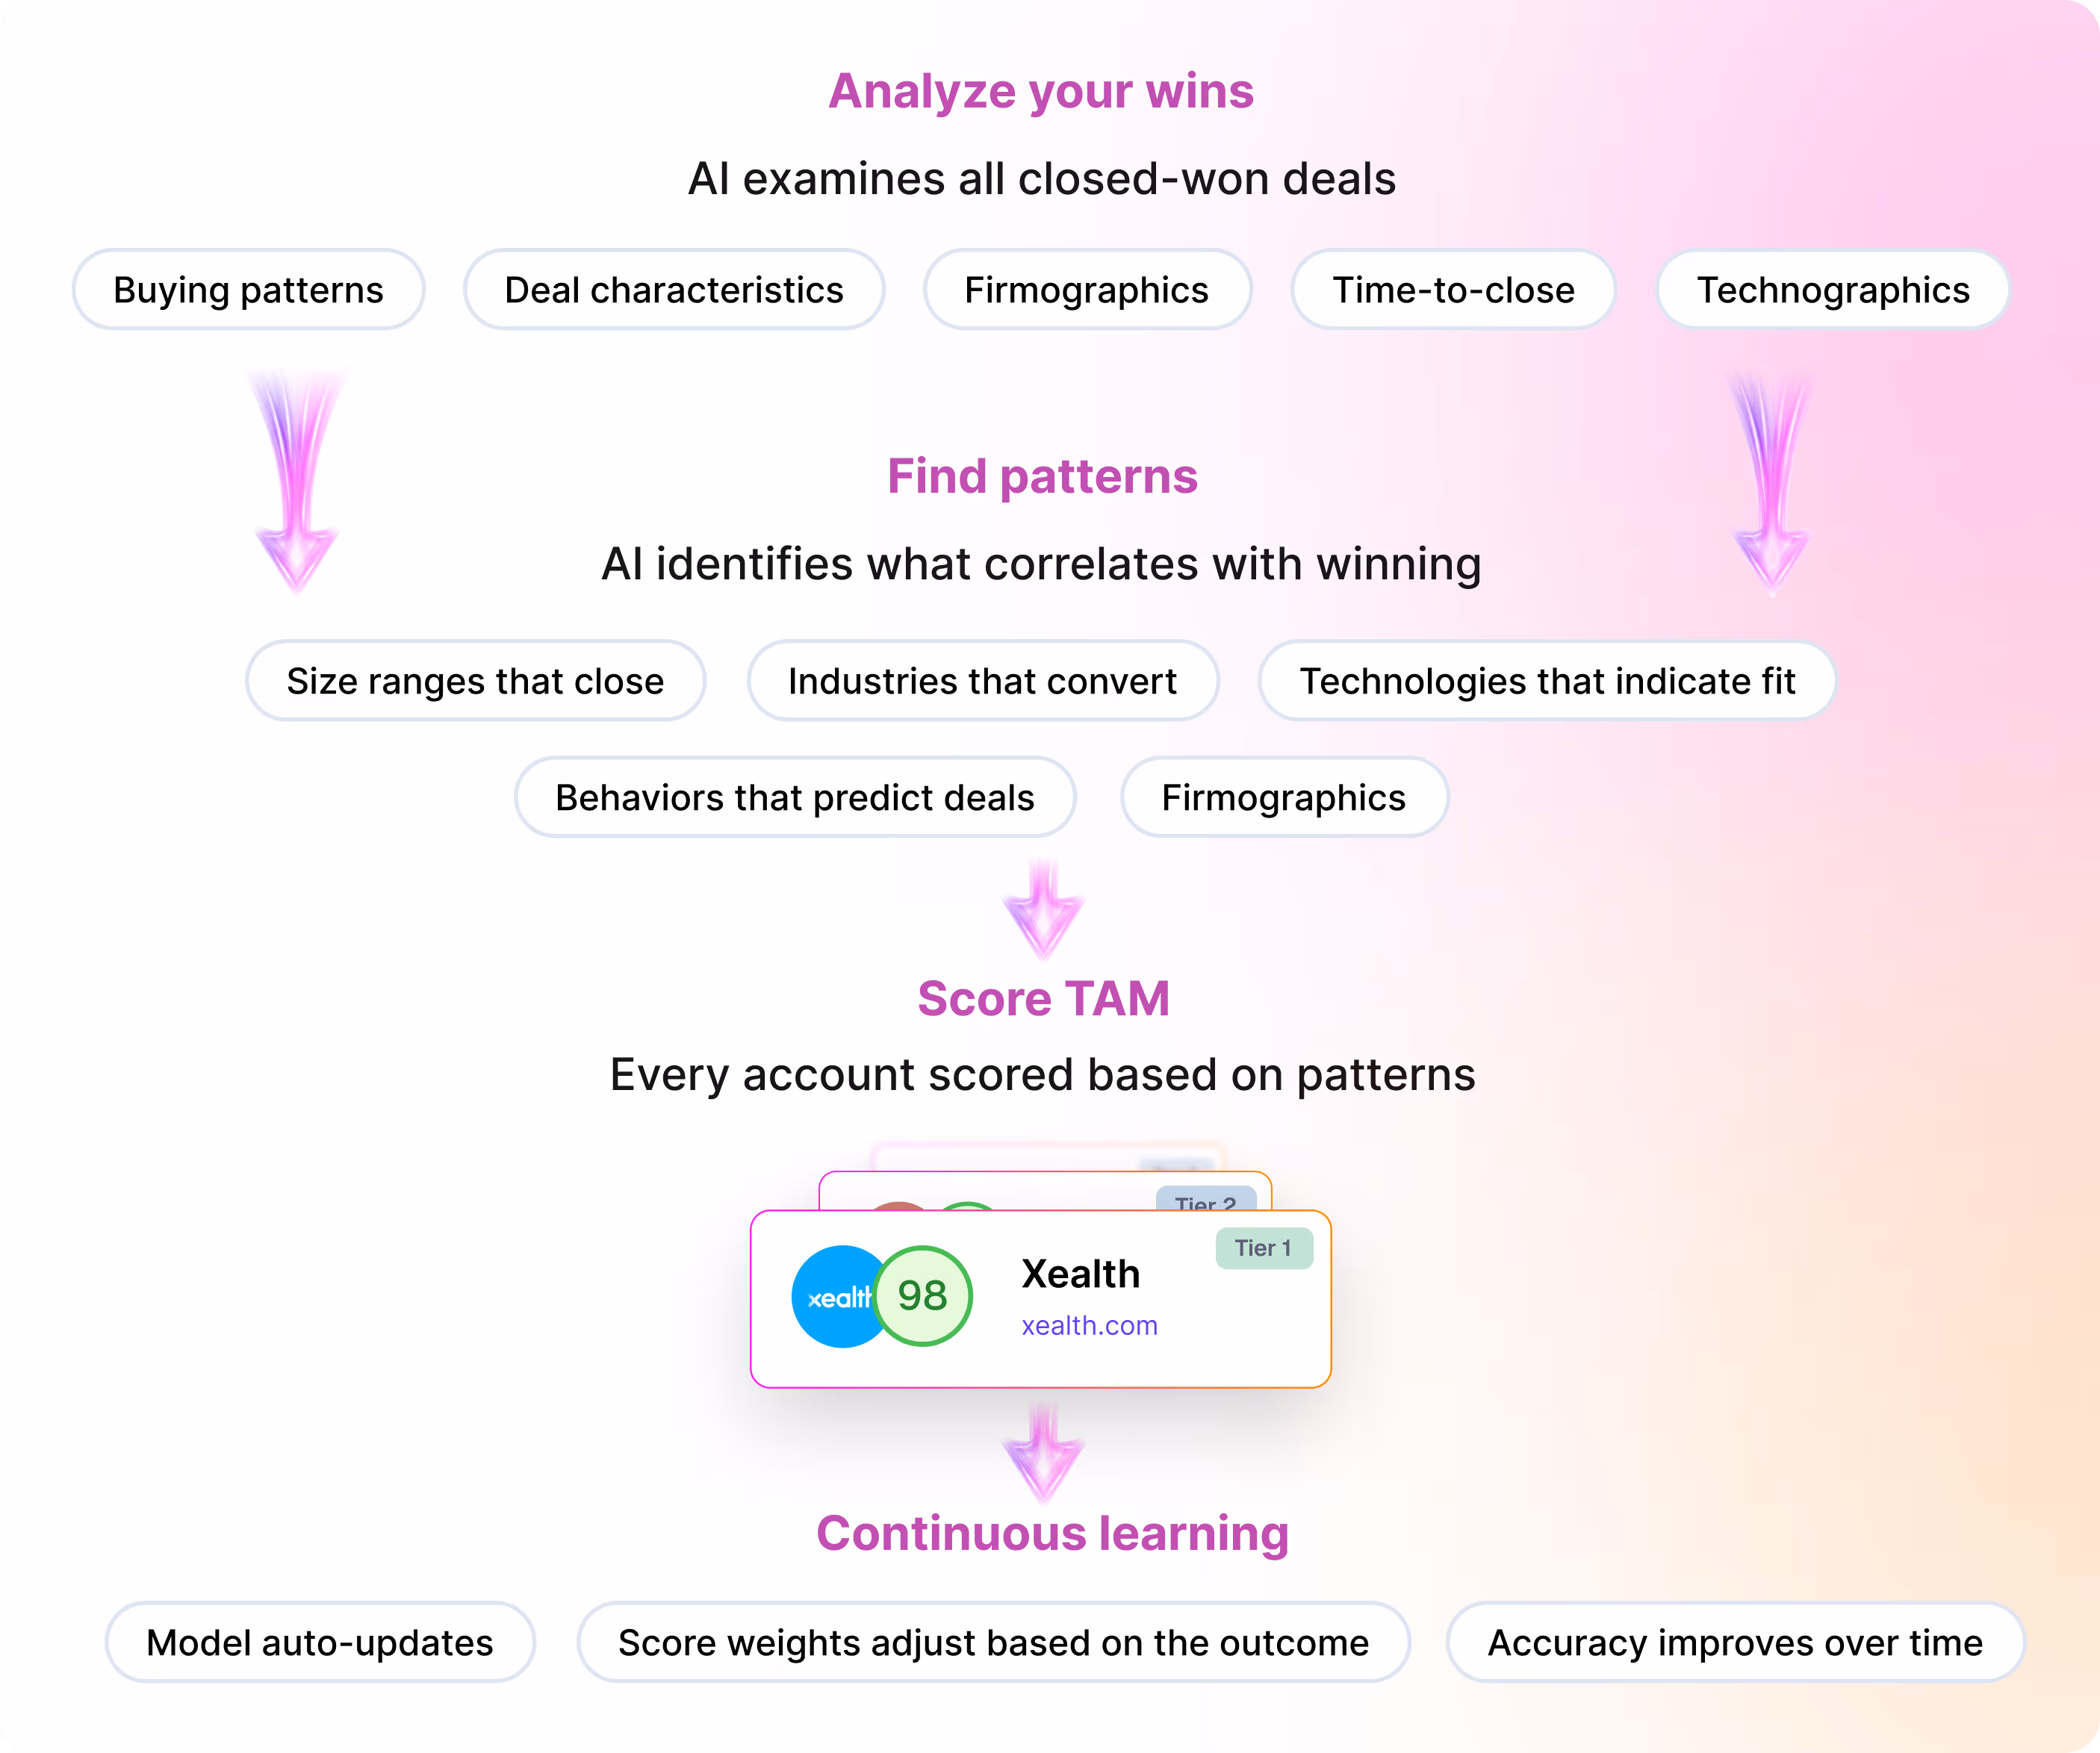
AI ICP Tiering automatically scores and tiers accounts based on fit
Learns from your data
Analyzes closed-won deals to find patterns
Scores every account
Entire TAM rated for fit
Explains its reasoning
See why each account scored the way it did
Continuously improves
Gets smarter as you close more deals
Surfaces hidden gems
Finds accounts you didn't know fit your ICP
How tiers work
Tier 1
Perfect fit, highest priority
Tier 2
Good fit, should pursue
Tier 3
Moderate fit, lower priority
Not ICP
Poor fit, deprioritize
Best for
Teams without formal ICP definition
Companies wanting data-driven (not gut-driven) targeting
RevOps building scoring models
Manual ICP Definition
AI ICP Tiering
Leadership picks characteristics
AI learns from closed-won deals
Someone builds a scoring spreadsheet
Patterns discovered automatically
Weights are guessed based on intuition
Weights derived from actual wins
Months later, results don't match
Continuous learning improves accuracy
Nobody updates the model
Model updates with every deal
Bias
Target who we think, not who buys
Leadership picks ICP characteristics based on assumptions about ideal customers
Result: Wasted effort on accounts that rarely convert
Static
Model doesn't learn from new data
Traditional scoring models are built once and never updated, becoming stale
Result: Accuracy degrades as market and product evolve
Opaque
Nobody knows why scores are what they are
Black-box scores make it impossible to trust or act on recommendations
Result: Reps don't trust scores and ignore them
Incomplete
Can't process all signals that matter
Manual models can only process a handful of firmographic signals
Result: Miss high-potential accounts that don't fit the narrow criteria
Crush your quotaCrush your quota
Company size (employees, revenue)
Sweet spot for deal size
Industry and vertical
Where you win most
Geography and regions
Territory strength
Company age and stage
Best timing to engage
Funding history
Budget availability
Current tech stack
Integration compatibility
Competitive technologies
Displacement opportunity
Technology spending
Budget allocation
Recent technology changes
Active buying mode
Website engagement patterns
Interest level
Content consumption
Pain point focus
Sales cycle length
Deal velocity prediction
Buying committee size
Complexity indicator
Average contract value
Segment value
Win rate by segment
Where to focus
Time to close
Pipeline planning
Expansion patterns
LTV prediction
Every account score includes explanation
Account Acme Corp
Tier Tier 1
Score 92/100
Confidence High (87% pattern match)
Key factors
Employee count (250) matches sweet spot
SaaS industry — 3x higher win rate
Uses Salesforce — 40% faster close
No competitor tech installed
Similar tech stack to 15 closed-won deals
Why this matters
Reps know how to position
Marketing knows what to emphasize
You trust the score because you understand it
After Closed-Won
Pattern weights adjusted
New correlations identified
Model accuracy improves
After Closed-Lost
Negative signals identified
Disqualifying patterns learned
False positives reduced
Quarterly Review
Full model retraining option
New data sources incorporated
Dramatic accuracy improvements

ICP Tiering Powers Your Entire GTM Motion

Crush your quotaCrush your quota
TAM Agent Feature
How ICP Tiering Connects
Use tier as filter criteria ("Show Tier 1 only")
Combine fit (tier) + intent for full prioritization
Focus committee research on Tier 1-2 accounts
Route Tier 1 to premium sequences
Tier 3 accounts go to long-term nurture
Target Tier 1 accounts with awareness campaigns
0
Higher win rate on Tier 1 accounts
0
More pipeline in Tier 1
0
Faster qualification decisions
David Chase

More Deals, Same Team Size

"Warmly has allowed us to increase our pipeline targets by twenty percent without increasing headcount."
WorkBoard logo
David Chase
Sales Leaders / CROs
Charles Fox

Marketing That Converts

"We’ve doubled our average contract value, and our sales team freaking loves using it."
tovuti logo
Charles Fox
Marketing / Demand Gen
Stephanie Armand

Revenue Outcomes

"Warmly sourced MQLs closed fifty percent higher and thirty percent faster than our other sources."
qase logo
Stephanie Armand
RevOps
Building data-driven account scoring without guesswork
Challenge
Leadership wants ICP definition based on data, not intuition
Scoring model needs constant updating as market changes
Team needs to understand and trust the scores
Multiple data sources need to be incorporated
How AI ICP Tiering Helps
AI learns directly from closed-won patterns
Continuous learning keeps model current
Full explainability shows reasoning for every score
AI analyzes firmographics, technographics, behavior, and deal data
Result: "Finally have a scoring model I can defend with data, not opinions."
Focusing team on highest-potential accounts
Challenge
Reps waste time on accounts that never close
No clear criteria for which accounts to pursue
Pipeline quality varies wildly by rep
Hard to coach on account selection
How AI ICP Tiering Helps
Tier-based prioritization focuses on best fit
AI provides transparent scoring with reasoning
Consistent tiering across entire team
Scores become teachable framework
Result: "Reps now ask 'Is this Tier 1?' before investing time. Meeting quality is up 40%."
Targeting campaigns to highest-value segments
Challenge
ABM programs target based on assumptions
Campaign ROI varies by account segment
Hard to measure ICP alignment
Content strategy needs persona clarity
How AI ICP Tiering Helps
AI-identified tiers reveal actual best-fit segments
Focus budget on Tier 1 accounts
Tier distribution becomes measurable KPI
Tier patterns reveal common characteristics to message
Result: "Shifted 60% of ABM budget to Tier 1. Pipeline per dollar spent tripled."
Connect CRM
Closed-won deals are training data
AI analyzes patterns
Automatic, no configuration
Colorful magnifying glass icon with a globe in the center, symbolizing global search or insights.
Review initial model
See what AI learned
Apply to TAM
All accounts scored
Monitor and improve
Accuracy increases over time

Common questions

FAQ

How much historical data do I need?
What if my ICP has changed?
Can I override AI scores?
How is this different from traditional scoring?
Does the model share data across companies?
Can I see what the model learned?
How does this connect to dynamic audiences?
How quickly does the model start working?
Can I customize which signals the AI considers?

Connect with Our Experts

Book a 15-minute conversation with a customer of ours and discover how Metric transforms their GTM strategy.